I am personally a fan of the program, not the logo.
Having said that, here's a puppy:
Having said that, here's a puppy:


Follow along with the video below to see how to install our site as a web app on your home screen.
Note: This feature may not be available in some browsers.
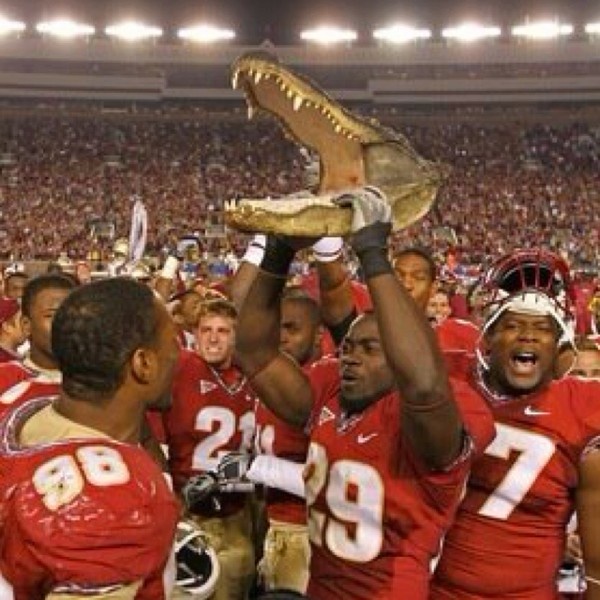
Every picture tells a story, and this one is impressive.That is awesome
woo hoo my first blocking! Seriously, they had an ad that dropped down and took up literally 3/4 of the screen.
Love the de-cleater by #8 too.THIS made me say awwwwwwwww:


Why Revenue Gap?
Why did ACC Schools make less money in 2016-17?
Last week USA Today published total revenue and expense numbers for all FBS schools for the 2016-17 fiscal year.
The question is, why are ACC schools trailing so much in total revenue?
Is it in the ticket sales? Let's see...
RK School Ticket Sales
1 Texas $72,457,216
2 Ohio State $61,560,351
3 Michigan $55,327,816
4 Texas A&M $47,458,538
5 Oklahoma $42,142,811
6 LSU $41,855,036
7 Arkansas $40,766,509
8 Alabama $37,642,667
9 Nebraska $37,258,695
10 Tennessee $36,781,724
11 Penn State $35,500,704
12 Auburn $32,991,096
13 Kentucky $32,597,109
14 Louisville $29,477,742
15 Wisconsin $28,773,188
16 Georgia $28,728,491
17 Iowa $28,253,233
18 South Carolina $28,018,240
19 Michigan State $26,802,465
20 Oregon $26,492,333
21 Washington $26,480,596
22 Clemson $25,960,272
23 Florida State $25,046,047
24 Florida $24,506,525
25 North Carolina $23,806,771
26 Mississippi $23,738,310
27 UCLA $21,744,254
28 N C State $21,219,458
29 Minnesota $20,500,383
30 West Virginia $20,222,242
31 Oklahoma State $19,679,074
32 Kansas $18,957,247
33 Indiana $18,089,310
34 Missouri $17,993,862
35 Virginia Tech $17,312,067
36 Utah $17,097,290
37 Mississippi State $15,782,114
38 Arizona $15,490,786
39 Maryland $15,291,690
40 Kansas State $15,274,064
41 Iowa State $14,260,192
42 Colorado $13,815,396
43 California $13,483,996
44 Oregon State $13,346,970
45 Illinois $12,825,263
46 Rutgers $12,824,201
47 Virginia $12,339,296
48 Texas Tech $11,970,439
49 Georgia Tech $11,756,425
50 Arizona State $10,033,481
51 Connecticut $9,843,615
52 Purdue $9,222,191
53 Memphis $8,804,547
54 Washington State $7,656,362
55 Cincinnati $7,420,821
56 Houston $6,551,591
57 South Florida $6,071,874
58 San Diego State $5,809,058
59 Central Florida $4,458,254
60 Air Force $3,542,723
ACC teams aren't among the top in ticket sales, but many of them can hang with the likes of Georgia, Wisconsin, Michigan State and Florida.
The average ticket sales for the top 60 teams is $22.8M; the ACC average (for the public schools) is $20.8M -- a difference of only $2M.
Is it in the donations? Let's see...
RK School Contributions
1 Texas A&M $93,134,590
2 Oregon $55,713,539
3 Georgia $54,804,606
4 Texas $46,019,194
5 Oklahoma $45,504,839
6 Florida $45,134,633
7 Florida State $41,504,734
8 Louisville $39,268,342
9 Michigan $38,879,908
10 South Carolina $38,810,243
11 Ohio State $37,612,937
12 LSU $36,973,785
13 Tennessee $35,428,068
14 Auburn $35,411,244
15 Washington $35,367,278
16 West Virginia $34,599,908
17 Clemson $33,782,757
18 Alabama $33,011,723
19 Michigan State $32,363,526
20 Mississippi $32,355,158
21 Iowa $31,999,038
22 Penn State $30,779,975
23 Nebraska $26,599,584
24 Virginia $26,127,871
25 Texas Tech $25,692,336
26 Mississippi State $25,035,952
27 Arkansas $24,907,874
28 Illinois $24,521,958
29 Wisconsin $24,110,895
30 Missouri $23,581,545
31 Indiana $23,103,658
32 Kansas $23,042,524
33 Kansas State $22,154,333
34 Purdue $21,679,168
35 North Carolina $21,388,432
36 California $20,539,482
37 Arizona State $19,802,494
38 Kentucky $18,716,315
39 UCLA $18,680,427
40 Arizona $18,169,527
41 Iowa State $17,551,225
42 Colorado $15,973,080
43 Virginia Tech $15,766,272
44 Oklahoma State $15,573,414
45 N C State $15,078,662
46 Minnesota $14,018,855
47 Maryland $12,281,532
48 Georgia Tech $11,187,993
49 Central Florida $10,303,140
50 Houston $9,923,994
51 Oregon State $9,785,111
52 Memphis $9,279,348
53 Utah $9,031,413
54 San Diego State $8,826,053
55 Air Force $8,705,370
56 Washington State $8,212,785
57 Rutgers $8,125,201
58 Connecticut $5,666,522
59 Cincinnati $4,019,074
60 South Florida $2,566,098
There are a couple of top 10 teams in the donations category, and several ACC schools do well here.
The average donations for the top 60 teams is $25.5M; the ACC average (for the public schools) is $25.5M -- ACC teams are slightly ahead of the average, in fact.
No, it's the rights and licensing!
RK School Rights and
Licensing
1 Texas $86,180,263
2 Wisconsin $72,881,272
3 Kentucky $72,699,939
4 Michigan $72,426,033
5 Alabama $68,798,600
6 Ohio State $67,221,825
7 Tennessee $64,551,741
8 Auburn $64,172,670
9 Florida $63,925,413
10 LSU $62,210,369
11 Georgia $61,580,759
12 Texas A&M $61,308,222
13 Arkansas $60,511,806
14 Minnesota $58,336,123
15 Penn State $57,847,205
16 Michigan State $57,429,487
17 South Carolina $56,169,427
18 Mississippi State $54,843,236
19 Oklahoma $54,785,533
20 Indiana $54,628,351
21 Oregon $54,172,744
22 Washington $53,221,324
23 UCLA $53,104,179
24 Mississippi $52,989,194
25 Iowa $52,916,024
26 Nebraska $52,022,217
27 Illinois $51,106,796
28 Arizona State $50,682,502
29 Missouri $50,138,134
30 Purdue $48,635,900
31 Maryland $48,250,773
32 Kansas $45,958,547
33 Oklahoma State $45,333,722
34 California $44,608,242
35 Iowa State $44,522,437
36 Kansas State $44,149,409
37 Arizona $44,010,303
38 Oregon State $43,615,846
39 Texas Tech $42,883,884
40 West Virginia $42,509,496
41 Louisville $41,700,556
42 Utah $40,955,439
43 Clemson $40,625,022
44 Colorado $39,736,432
45 N C State $38,408,049
46 Washington State $38,045,924
47 Florida State $36,709,768
48 Virginia Tech $36,617,659
49 North Carolina $36,499,371
50 Virginia $35,595,956
51 Georgia Tech $35,089,773
52 Rutgers $25,440,105
53 Connecticut $24,501,727
54 Cincinnati $17,824,578
55 South Florida $16,352,125
56 San Diego State $11,682,122
57 Memphis $11,068,591
58 Air Force $11,039,416
59 Central Florida $10,733,983
60 Houston $9,721,767
The average rights and licensing revenue for the top 60 teams is $46.6M; the ACC average (for the public schools) is $37.7M -- an $8.9M gap! [NOTE: Just to clarify - an extra $9M only gets you to the P5 average, which is the Purdue/Missouri level.
Auburn gets about $24 million more than Clemson.
Kentucky gets $31 million more than Louisville.
That's CRAZY!
Keep in mind that a big chunk of this is TV revenue, though there is some radio, apparel, etc. mixed in as well. The ACC Network should make up most of that average gap; individual schools will need to negotiate better-paying apparel deals, etc. on their own.
Need Texas in ACC
Why Revenue Gap?
Why did ACC Schools make less money in 2016-17?
Last week USA Today published total revenue and expense numbers for all FBS schools for the 2016-17 fiscal year.
No, it's the rights and licensing!
RK School Rights and
Licensing
1 Texas $86,180,263
2 Wisconsin $72,881,272
3 Kentucky $72,699,939
4 Michigan $72,426,033
5 Alabama $68,798,600
6 Ohio State $67,221,825
7 Tennessee $64,551,741
8 Auburn $64,172,670
9 Florida $63,925,413
10 LSU $62,210,369
11 Georgia $61,580,759
12 Texas A&M $61,308,222
13 Arkansas $60,511,806
14 Minnesota $58,336,123
15 Penn State $57,847,205
16 Michigan State $57,429,487
17 South Carolina $56,169,427
18 Mississippi State $54,843,236
19 Oklahoma $54,785,533
20 Indiana $54,628,351
21 Oregon $54,172,744
22 Washington $53,221,324
23 UCLA $53,104,179
24 Mississippi $52,989,194
25 Iowa $52,916,024
26 Nebraska $52,022,217
27 Illinois $51,106,796
28 Arizona State $50,682,502
29 Missouri $50,138,134
30 Purdue $48,635,900
31 Maryland $48,250,773
32 Kansas $45,958,547
33 Oklahoma State $45,333,722
34 California $44,608,242
35 Iowa State $44,522,437
36 Kansas State $44,149,409
37 Arizona $44,010,303
38 Oregon State $43,615,846
39 Texas Tech $42,883,884
40 West Virginia $42,509,496
The average rights and licensing revenue for the top 60 teams is $46.6M; the ACC average (for the public schools) is $37.7M -- an $8.9M gap! [NOTE: Just to clarify - an extra $9M only gets you to the P5 average, which is the Purdue/Missouri level.
Auburn gets about $24 million more than Clemson.
Kentucky gets $31 million more than Louisville.
That's CRAZY!
Keep in mind that a big chunk of this is TV revenue, though there is some radio, apparel, etc. mixed in as well. The ACC Network should make up most of that average gap; individual schools will need to negotiate better-paying apparel deals, etc. on their own.
Need Texas in ACC
Why Revenue Gap?
Why did ACC Schools make less money in 2016-17?
Last week USA Today published total revenue and expense numbers for all FBS schools for the 2016-17 fiscal year.
The question is, why are ACC schools trailing so much in total revenue?
Is it in the ticket sales? Let's see...
RK School Ticket Sales
1 Texas $72,457,216
2 Ohio State $61,560,351
3 Michigan $55,327,816
4 Texas A&M $47,458,538
5 Oklahoma $42,142,811
6 LSU $41,855,036
7 Arkansas $40,766,509
8 Alabama $37,642,667
9 Nebraska $37,258,695
10 Tennessee $36,781,724
11 Penn State $35,500,704
12 Auburn $32,991,096
13 Kentucky $32,597,109
14 Louisville $29,477,742
15 Wisconsin $28,773,188
16 Georgia $28,728,491
17 Iowa $28,253,233
18 South Carolina $28,018,240
19 Michigan State $26,802,465
20 Oregon $26,492,333
21 Washington $26,480,596
22 Clemson $25,960,272
23 Florida State $25,046,047
24 Florida $24,506,525
25 North Carolina $23,806,771
26 Mississippi $23,738,310
27 UCLA $21,744,254
28 N C State $21,219,458
29 Minnesota $20,500,383
30 West Virginia $20,222,242
31 Oklahoma State $19,679,074
32 Kansas $18,957,247
33 Indiana $18,089,310
34 Missouri $17,993,862
35 Virginia Tech $17,312,067
36 Utah $17,097,290
37 Mississippi State $15,782,114
38 Arizona $15,490,786
39 Maryland $15,291,690
40 Kansas State $15,274,064
41 Iowa State $14,260,192
42 Colorado $13,815,396
43 California $13,483,996
44 Oregon State $13,346,970
45 Illinois $12,825,263
46 Rutgers $12,824,201
47 Virginia $12,339,296
48 Texas Tech $11,970,439
49 Georgia Tech $11,756,425
50 Arizona State $10,033,481
51 Connecticut $9,843,615
52 Purdue $9,222,191
53 Memphis $8,804,547
54 Washington State $7,656,362
55 Cincinnati $7,420,821
56 Houston $6,551,591
57 South Florida $6,071,874
58 San Diego State $5,809,058
59 Central Florida $4,458,254
60 Air Force $3,542,723
ACC teams aren't among the top in ticket sales, but many of them can hang with the likes of Georgia, Wisconsin, Michigan State and Florida.
The average ticket sales for the top 60 teams is $22.8M; the ACC average (for the public schools) is $20.8M -- a difference of only $2M.
Is it in the donations? Let's see...
RK School Contributions
1 Texas A&M $93,134,590
2 Oregon $55,713,539
3 Georgia $54,804,606
4 Texas $46,019,194
5 Oklahoma $45,504,839
6 Florida $45,134,633
7 Florida State $41,504,734
8 Louisville $39,268,342
9 Michigan $38,879,908
10 South Carolina $38,810,243
11 Ohio State $37,612,937
12 LSU $36,973,785
13 Tennessee $35,428,068
14 Auburn $35,411,244
15 Washington $35,367,278
16 West Virginia $34,599,908
17 Clemson $33,782,757
18 Alabama $33,011,723
19 Michigan State $32,363,526
20 Mississippi $32,355,158
21 Iowa $31,999,038
22 Penn State $30,779,975
23 Nebraska $26,599,584
24 Virginia $26,127,871
25 Texas Tech $25,692,336
26 Mississippi State $25,035,952
27 Arkansas $24,907,874
28 Illinois $24,521,958
29 Wisconsin $24,110,895
30 Missouri $23,581,545
31 Indiana $23,103,658
32 Kansas $23,042,524
33 Kansas State $22,154,333
34 Purdue $21,679,168
35 North Carolina $21,388,432
36 California $20,539,482
37 Arizona State $19,802,494
38 Kentucky $18,716,315
39 UCLA $18,680,427
40 Arizona $18,169,527
41 Iowa State $17,551,225
42 Colorado $15,973,080
43 Virginia Tech $15,766,272
44 Oklahoma State $15,573,414
45 N C State $15,078,662
46 Minnesota $14,018,855
47 Maryland $12,281,532
48 Georgia Tech $11,187,993
49 Central Florida $10,303,140
50 Houston $9,923,994
51 Oregon State $9,785,111
52 Memphis $9,279,348
53 Utah $9,031,413
54 San Diego State $8,826,053
55 Air Force $8,705,370
56 Washington State $8,212,785
57 Rutgers $8,125,201
58 Connecticut $5,666,522
59 Cincinnati $4,019,074
60 South Florida $2,566,098
There are a couple of top 10 teams in the donations category, and several ACC schools do well here.
The average donations for the top 60 teams is $25.5M; the ACC average (for the public schools) is $25.5M -- ACC teams are slightly ahead of the average, in fact.
No, it's the rights and licensing!
RK School Rights and
Licensing
1 Texas $86,180,263
2 Wisconsin $72,881,272
3 Kentucky $72,699,939
4 Michigan $72,426,033
5 Alabama $68,798,600
6 Ohio State $67,221,825
7 Tennessee $64,551,741
8 Auburn $64,172,670
9 Florida $63,925,413
10 LSU $62,210,369
11 Georgia $61,580,759
12 Texas A&M $61,308,222
13 Arkansas $60,511,806
14 Minnesota $58,336,123
15 Penn State $57,847,205
16 Michigan State $57,429,487
17 South Carolina $56,169,427
18 Mississippi State $54,843,236
19 Oklahoma $54,785,533
20 Indiana $54,628,351
21 Oregon $54,172,744
22 Washington $53,221,324
23 UCLA $53,104,179
24 Mississippi $52,989,194
25 Iowa $52,916,024
26 Nebraska $52,022,217
27 Illinois $51,106,796
28 Arizona State $50,682,502
29 Missouri $50,138,134
30 Purdue $48,635,900
31 Maryland $48,250,773
32 Kansas $45,958,547
33 Oklahoma State $45,333,722
34 California $44,608,242
35 Iowa State $44,522,437
36 Kansas State $44,149,409
37 Arizona $44,010,303
38 Oregon State $43,615,846
39 Texas Tech $42,883,884
40 West Virginia $42,509,496
41 Louisville $41,700,556
42 Utah $40,955,439
43 Clemson $40,625,022
44 Colorado $39,736,432
45 N C State $38,408,049
46 Washington State $38,045,924
47 Florida State $36,709,768
48 Virginia Tech $36,617,659
49 North Carolina $36,499,371
50 Virginia $35,595,956
51 Georgia Tech $35,089,773
52 Rutgers $25,440,105
53 Connecticut $24,501,727
54 Cincinnati $17,824,578
55 South Florida $16,352,125
56 San Diego State $11,682,122
57 Memphis $11,068,591
58 Air Force $11,039,416
59 Central Florida $10,733,983
60 Houston $9,721,767
The average rights and licensing revenue for the top 60 teams is $46.6M; the ACC average (for the public schools) is $37.7M -- an $8.9M gap! [NOTE: Just to clarify - an extra $9M only gets you to the P5 average, which is the Purdue/Missouri level.
Auburn gets about $24 million more than Clemson.
Kentucky gets $31 million more than Louisville.
That's CRAZY!
Keep in mind that a big chunk of this is TV revenue, though there is some radio, apparel, etc. mixed in as well. The ACC Network should make up most of that average gap; individual schools will need to negotiate better-paying apparel deals, etc. on their own.
Need Texas in ACC
Not sure if all the numbers are entirely accurate but are probably in the ballpark.Would love to hear from @Dot Com or @Jerry Kutz about these “rights and licensing” figures. For starters, are they accurate? Assuming they are even halfway reliable, how is FSU behind schools like Ole Miss, Mississippi State, Minnesota, Iowa, Kansas, etc.? And what is being done to try to improve and maximize this revenue stream? I will hang up and listen.
FSU has their first Five Star QB for the class of 2037!
http://www.espn.com/nfl/story/_/id/23999458/buccaneers-jameis-winston-fiancee-welcome-baby-boy
Allen, Winston's high school sweetheart, delivered a healthy baby boy, Antonor Malachi Winston, on Friday.
The original due date was July 4.
Winston named the baby Antonor after his father, to whom he is very close.
According to Winston's mother, Loretta, they chose Malachi as the middle name because it's the family's favorite book from the Bible, the last book of the Old Testament. In Hebrew, it means "my messenger" or "my angel."
Hmmm, noticed this in that article:
"He also just recently parted ways with his agents, Greg Genske and Kenny Felder, who had represented him since the start of his NFL career."
That is a really bad anti Jameis biased article right from the first sentence. Good grief.That is interesting, wonder if it was the agents or Jameis that made that decision
https://profootballtalk.nbcsports.com/2018/07/02/jameis-winston-parts-ways-with-his-agents/
Agree. The guy can't even have a child without some ahole reporter getting in his/her jabs.That is a really bad anti Jameis biased article right from the first sentence. Good grief.
That is interesting, wonder if it was the agents or Jameis that made that decision
https://profootballtalk.nbcsports.com/2018/07/02/jameis-winston-parts-ways-with-his-agents/
Per Pewter Report, it was Jameis's decision.
He brought that problem on himself. It’s not hard to understand the top pick in the draft is gong to be under heavy scrutiny. Behave better and it won’t be an issue. There are people in the press that behave unethically, very similar to the people they report on....Agree. The guy can't even have a child without some ahole reporter getting in his/her jabs.
There is no more decorum in the press.
Probably Winston. The agents are looking at a second contract soon.That is interesting, wonder if it was the agents or Jameis that made that decision
https://profootballtalk.nbcsports.com/2018/07/02/jameis-winston-parts-ways-with-his-agents/
I’m feeling some soccer love as well as some good ole ‘American football. We got some good coming on skrong.No posts
today yet?